


 54 / 98

54
rates during the second or third quarters of 2015, our
strategy for the year involved holding bonds to maturity,
with only a small increase in our overall position of such
instruments. The average yield on all bonds, irrespective
of denomination, rose by 0.11 percent to 2.45 percent
from 2.34 percent in the previous year.
In terms of our investment strategy for equity assets,
having previously pursued holdings of available-for-sale
assets, in November we disposed of all such holdings
so as to satisfy a requirement for substantial holdings of
working capital. The overall rate of return on investment
was 35 percent, equivalent to an annualized return of
10 percent, yielding an injection of NT$44.89 million in
working capital.
With financial operations having involved the disposal
of index funds and equity assets, yields on financial
investments, including exchange gains (losses) and other
gains (losses), rose to 2.11 percent from 1.58 percent
the previous year. Annual revenue derived from financial
investments rose by NT$53.52 million, or 34.6 percent,
to NT$208.24 million from NT$154.72 million in the
previous year, exceeding a target of NT$137.70 million by
NT$70.54 million, or 51 percent.
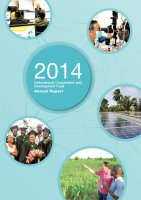
Figure 5 Investment Management (2014)
Investments for Development
Projects 12% ................
Financial Investments 63%
Lending for Development
Projects 25%
.........................
................
Investments for Development
Projects 12%
Index Funds / Equity
Assets 1% ...............
.............
Bank Deposits /
Short-term Notes 2%
...................
Time Deposits 46%
...........................................
Lending for Development
Projects 25%
............................................
.............................
Bonds 14%
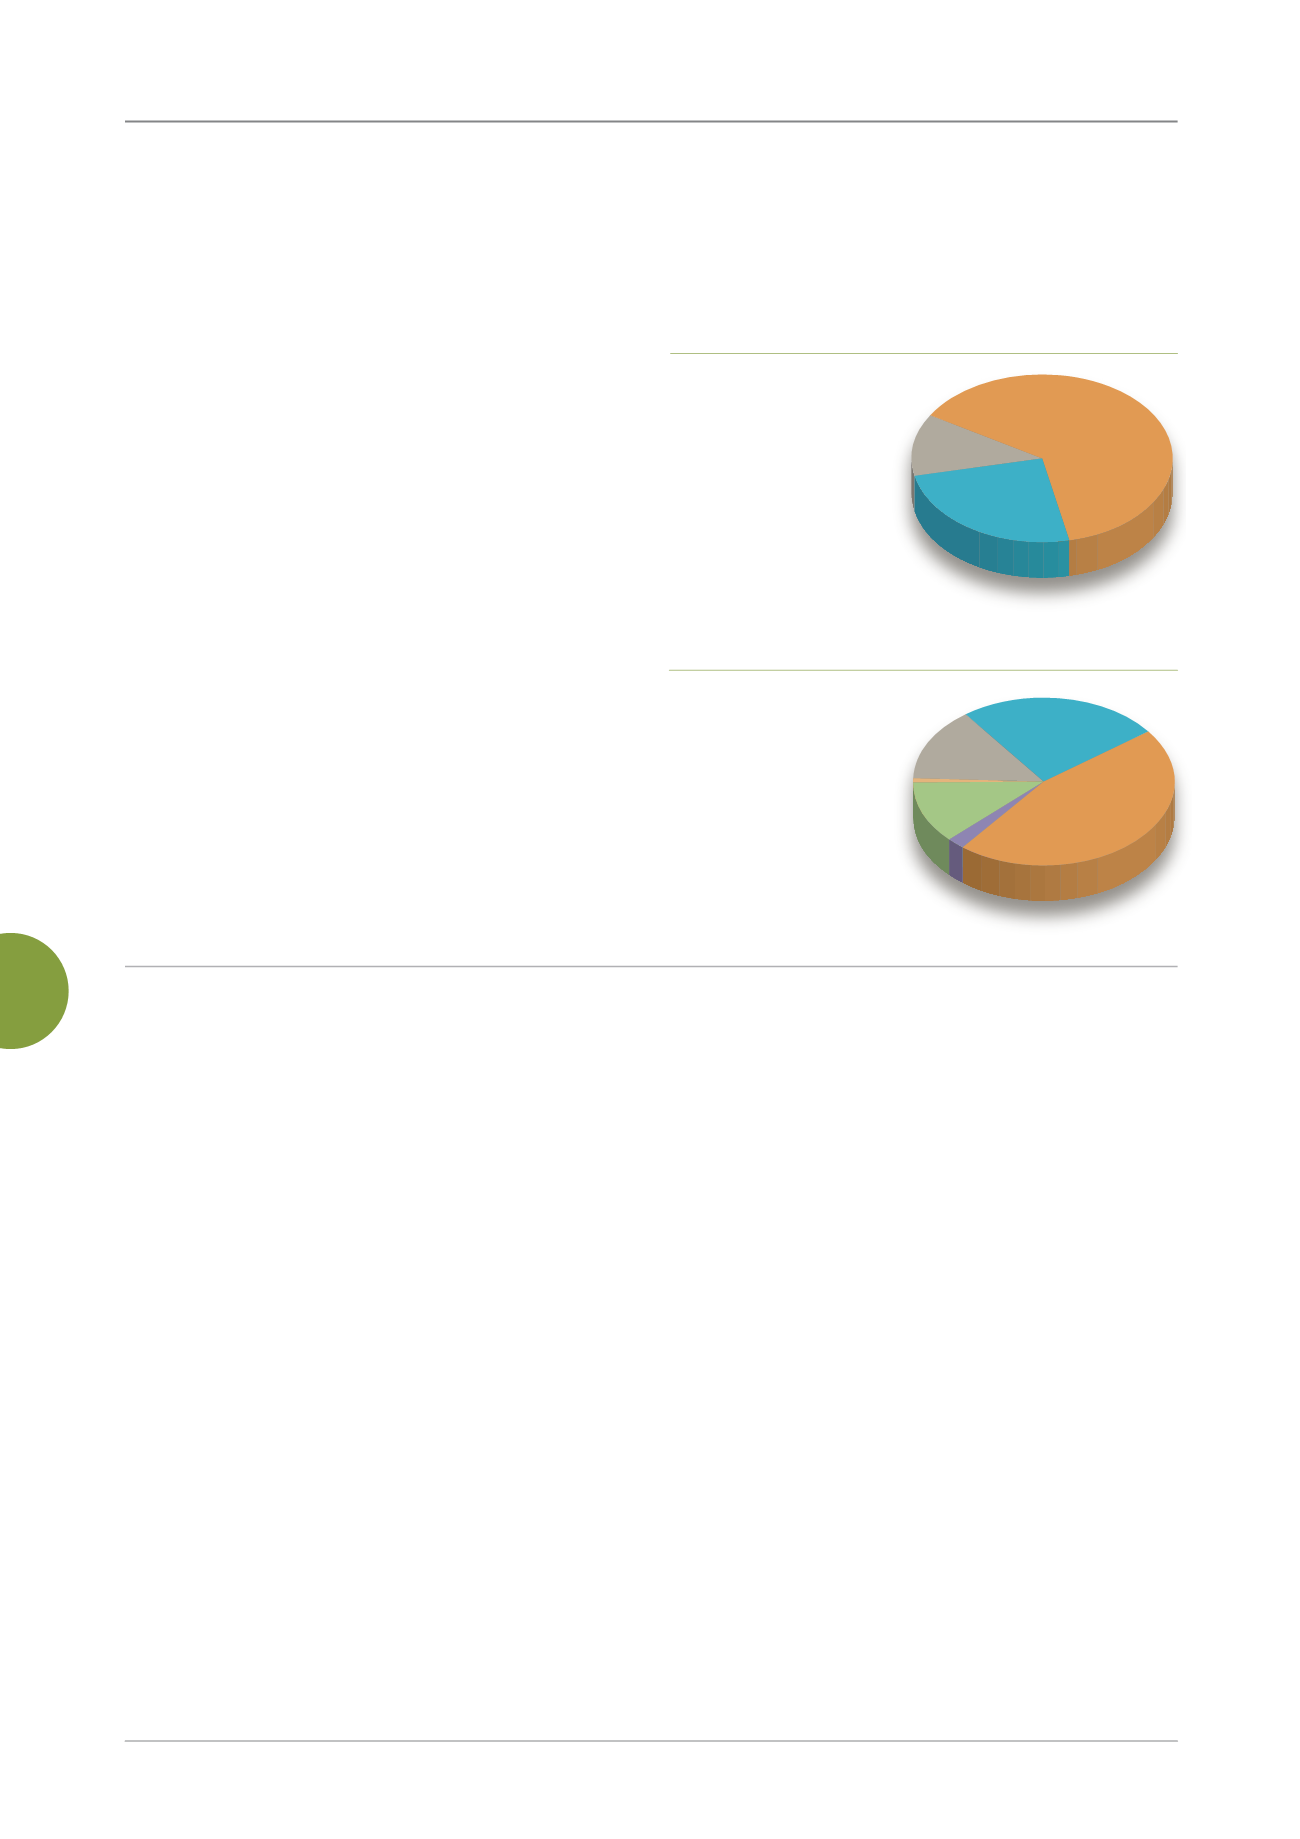
Figure 4 Fund Utilization (2014)
Investments for Development
Projects 12% ................
Financial Investments 63%
Lending for Development
Projects 25%
.........................
................
Investments for Development
Projects 12%
Index Funds / Equity
Assets 1% ...............
.............
Bank Deposits /
Short-term Notes 2%
...................
Time Deposits 46%
...........................................
Lending for Development
Projects 25%
............................................
.............................
Bonds 14
Accounting Management
The TaiwanICDF’s revenues are derived predominantly
from interest accrued on the Fund, interest from lending
operations and funding for MOFA-commissioned projects.
Interest accrued on the Fund and interest from lending
operations mainly support routine operations, including
technical cooperation projects, humanitarian assistance,
scholarship programs and workshops. It also supports
the TaiwanICDF’s own administrative, management and
general expenses. MOFA provides the majority share
of funding for commissioned projects to support the
operation of overseas technical and medical missions,
and specially commissioned projects.
In 2014, operating revenues and non-operating
income and gains amounted to NT$1.37 billion, of which
NT$990.54 million was allocated for commissioned
projects, a decrease of 6.3 percent from 2013. Revenue
generated through the use of the Fund was NT$382.16
million, an increase of 35.99 percent from 2013, of which
interest on fund investments comprised the largest share
(41%), followed by revenues from lending and investment
operations (26%), gains on sales of investment (12%) and
cash dividends (2%), with other revenues representing
the remaining share (19%).
Expenditures for 2014 were NT$1.37 billion, of which
NT$990.54 million was for commissioned projects, a
decrease of 6.3 percent from 2013. Expenditures made
through the use of the Fund were NT$375.13 million, a
decrease of 1.92 percent from 2013.
Revenue exceeded expenditures by NT$7.02 million
during 2014, representing a difference of NT$108.50
million from the NT$101.48 million excess of expenditures
over revenue in the previous year. This was mainly due to
the generation of income through the disposal of certain
holdings and the severance of diplomatic relations with
The Gambia, which brought an end to cooperative
bilateral relations, resulting in a reduction in expenditures
associated with technical cooperation and lending and
investment operations.
Fund Utilization and Balance
As of December 31, 2014, the net balance of the
Fund was NT$15.73 billion (including founding and
donated funds of NT$12.47 billion, accumulated earnings
of NT$3.26 billion and unrealized gains on financial
instruments of NT$300,000). This represented a decrease
of 0.08 percent, or NT$13.04 million, from the end of 2013.