


 90 / 106

90
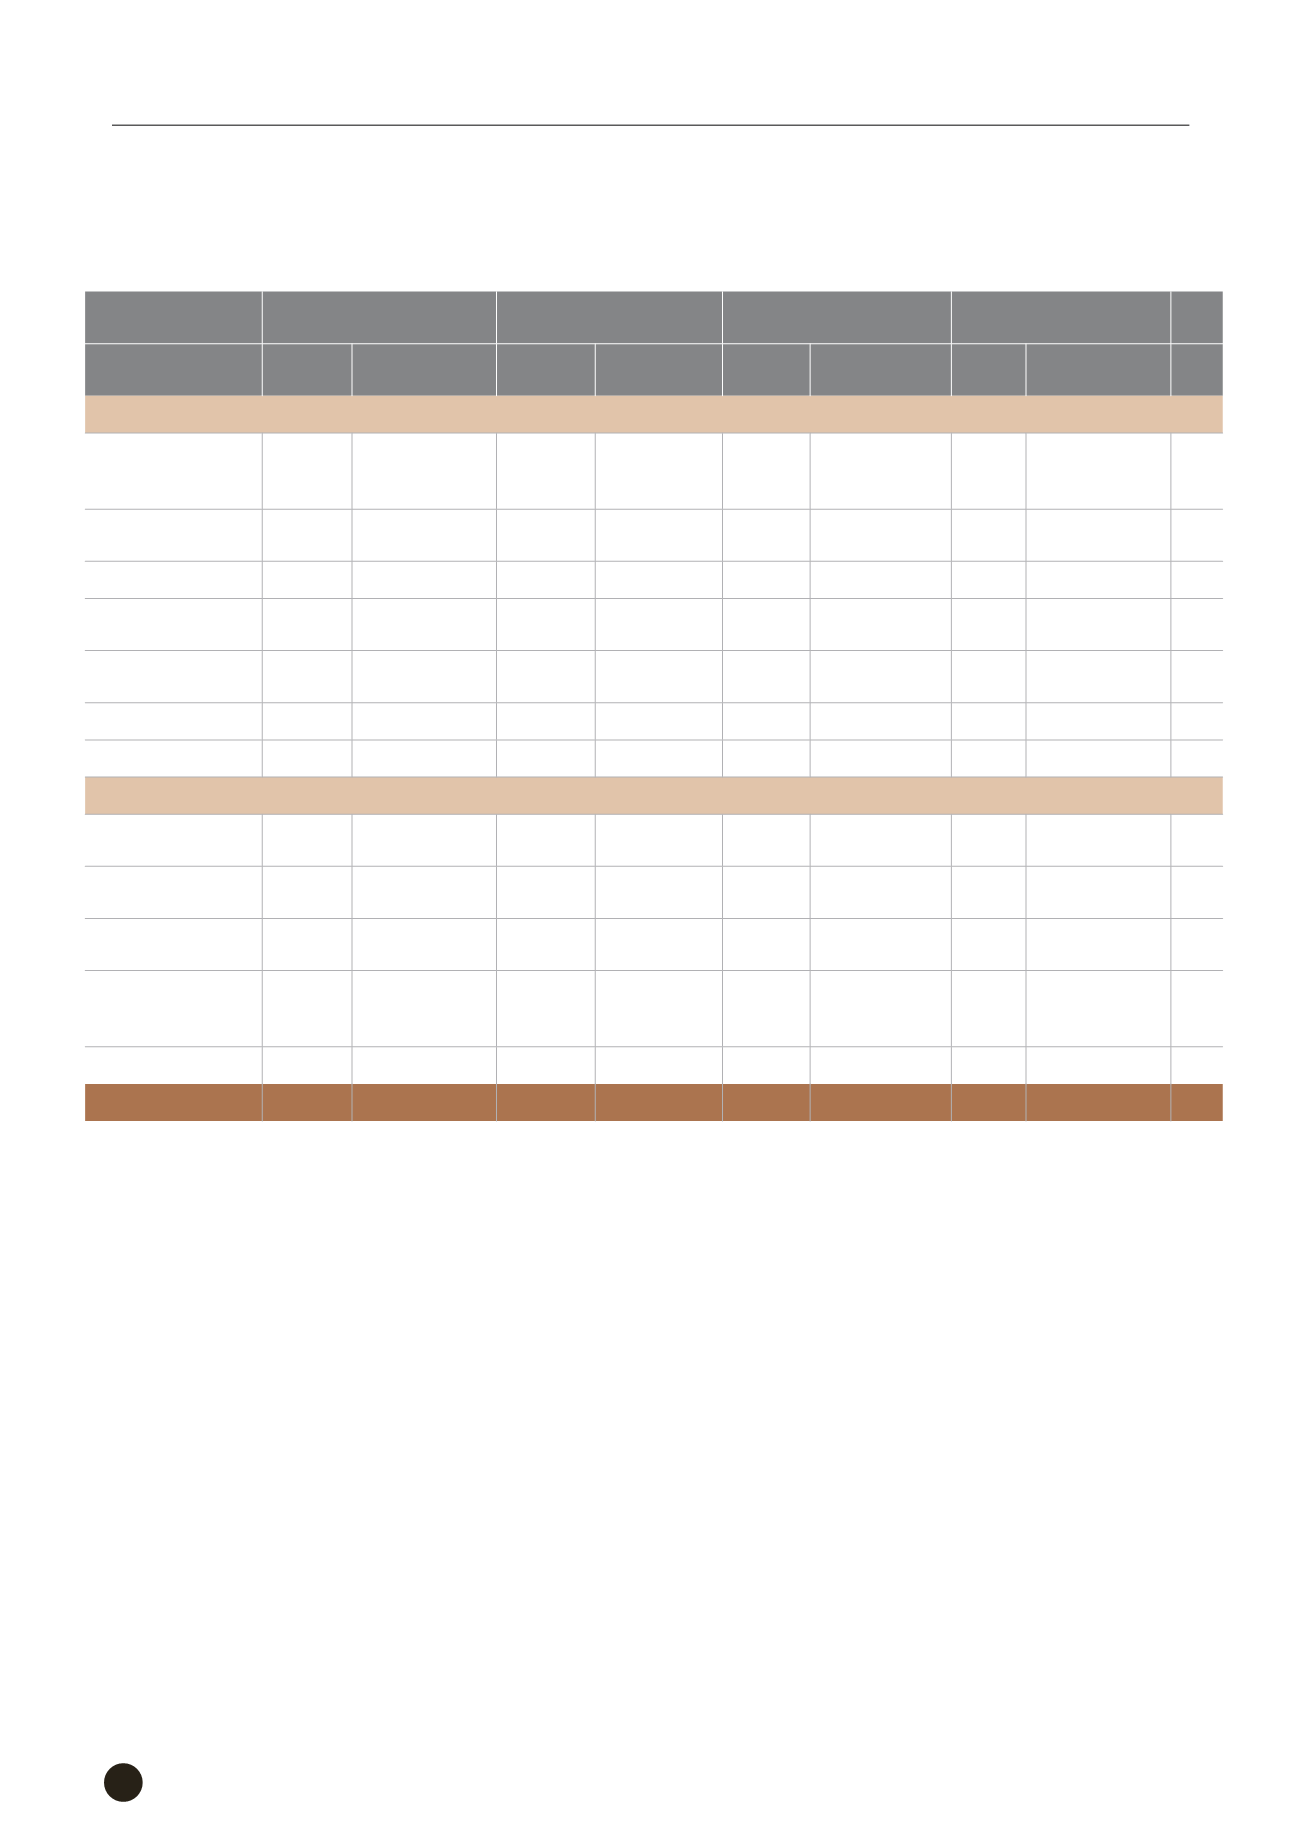
Beginning Balance
Acquisition of Long-term
Investments
Decrease in Long-term
Investments
Ending Balance
Owner-
ship
Carrying
Amount
Owner-
ship
Carrying
Amount
Owner-
ship
Carrying
Amount
Owner-
ship
Carrying
Amount
Note
Equity investments accounted for using cost method:
Overseas Investment
& Development
Corporation
14.44% $ 130,000,000
-
$ -
-
$ - 14.44% $ 130,000,000 None
Less: Accumulated
impairment
( 6,000,000 )
-
-
( 6,000,000 )
124,000,000
-
-
124,000,000
BTS Private Equity
Fund in India
6.8% 123,578,854
-
1,004,407
-
-
6.8% 124,583,261 None
Less: Accumulated
impairment
( 79,243,059 )
( 12,616,040 )
-
( 91,859,099 )
44,335,795
( 11,611,633 )
-
32,724,162
168,335,795
( 11,611,633 )
-
156,724,162
International Institution Investment Fund:
FIISF-Small Business
Account
325,000,000
-
( 325,000,000 )
- None
FIISF-Small Business
Account-Phase
Ⅱ
330,660,000
-
-
330,660,000 None
FIISF-Small Business
Account-Phase
Ⅲ
591,550,000
-
-
591,550,000 None
MIF-Specialized
Financial Intermediary
Development Fund
476,300,000
-
-
476,300,000 None
1,723,510,000
-
( 325,000,000 )
1,398,510,000
$ 1,891,845,795
( $ 11,611,633 )
( $325,000,000 )
$ 1,555,234,162
International Cooperation and Development Fund
Statement of Changes in Financial Assets Carried at Cost
For the Year Ended December 31, 2015
(Expressed in NT$)
(versión en inglés)