


 76 / 106

76
2015
2014
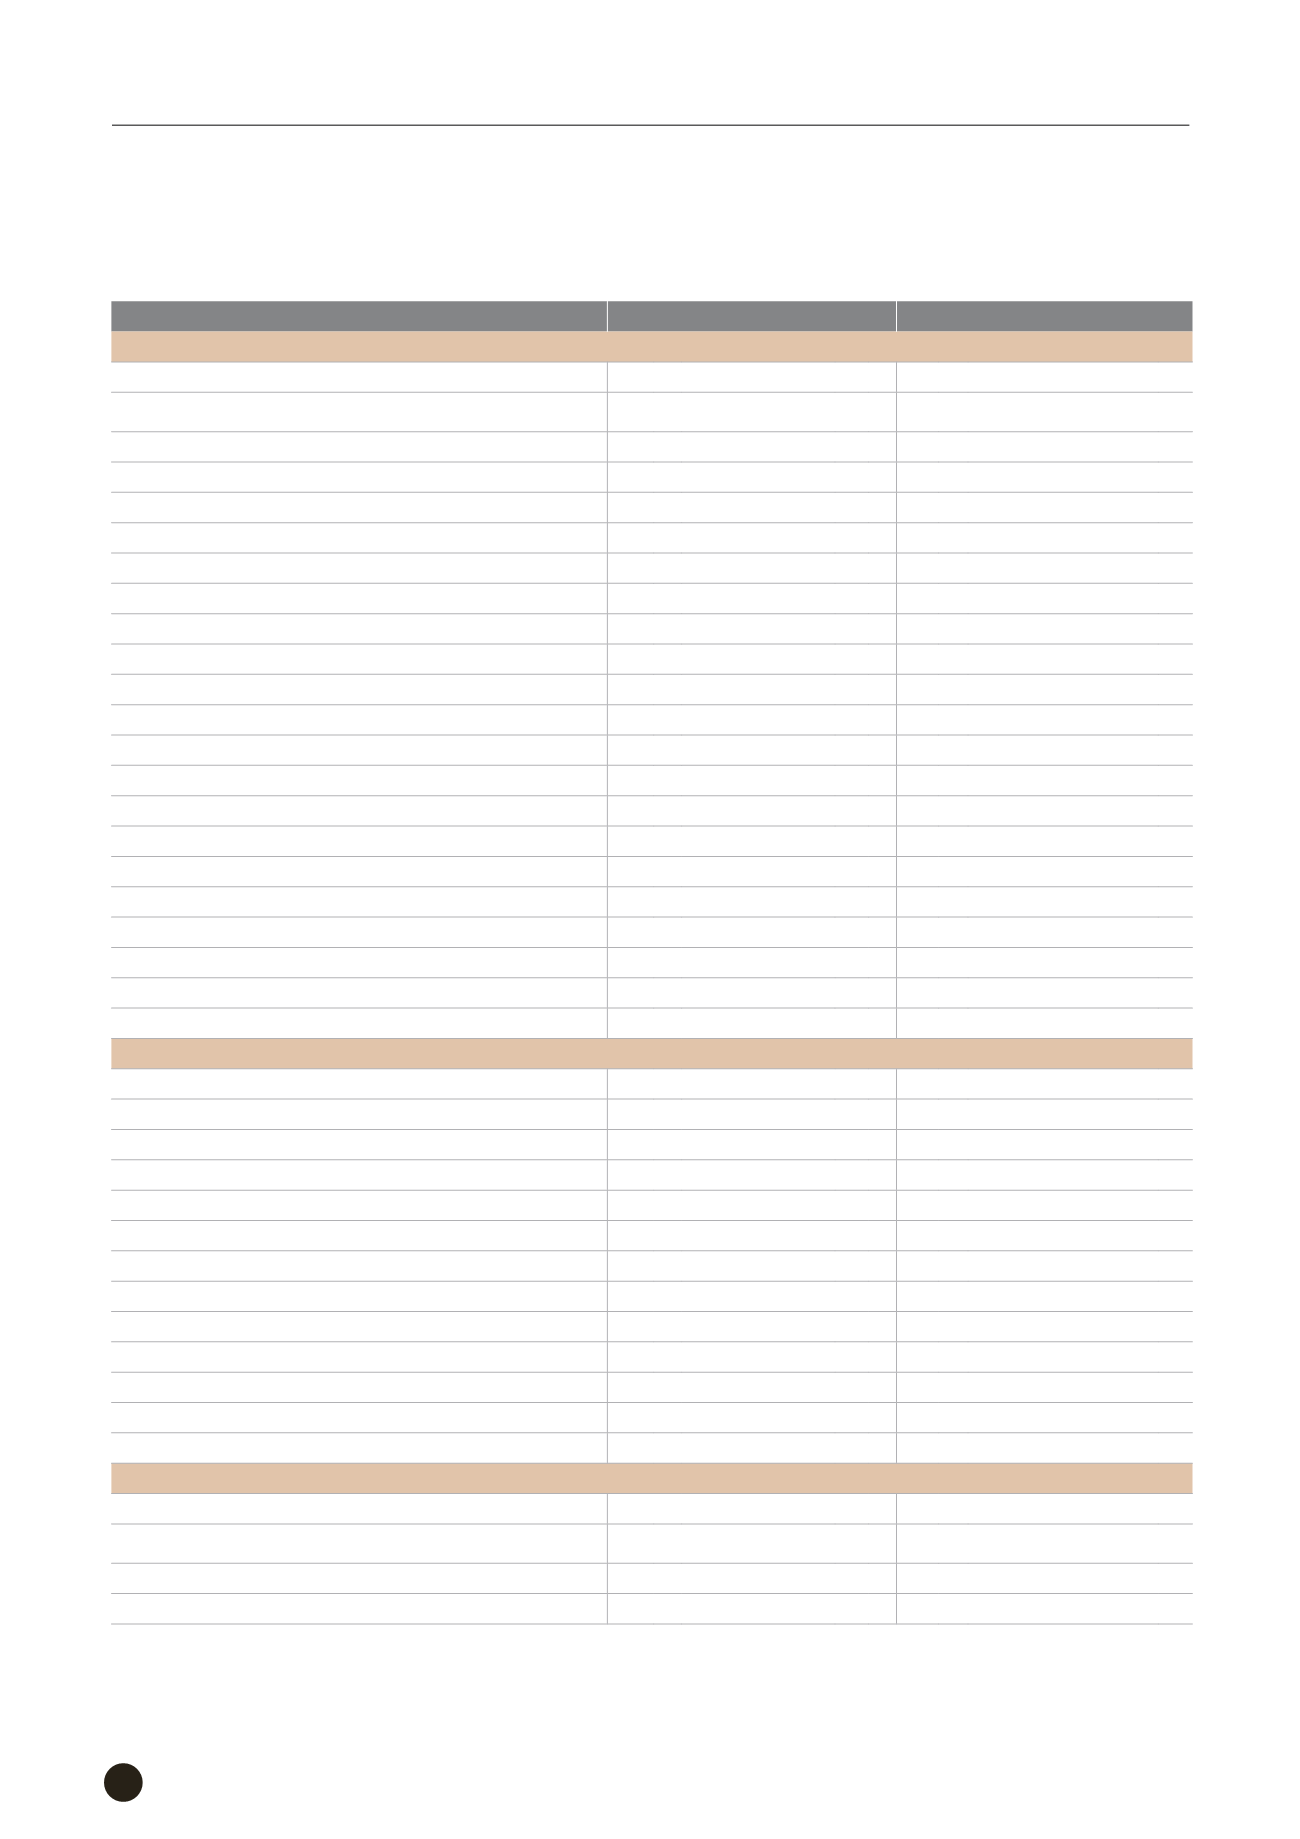
CASH FLOWS FROM OPERATING ACTIVITIES
Excess of revenues over expenses
$
59,323,768
$
7,021,992
Adjustments to reconcile excess of revenues over expenses to
net cash provided by (used in) operating activities:
Depreciation
3,458,495
3,892,215
Amortization
2,196,408
778,405
Reversal of allowance for bad debts
(
4,550,445
) (
4,839,579
)
Held-to-maturity financial assets - interest amortization
7,221,485
8,109,359
Impairment loss on financial assets carried at cost
12,616,040
25,743,735
Gain on disposal of investments
-
(
44,892,134
)
Loss on disposal of fixed assets
368,528
1,055,807
Changes in assets and liabilities:
Receivables
13,927,209
(
4,145,540
)
Prepayments
(
3,888,241
)
5,603,309
Other financial assets
-
932,897
Other current assets
(
476,971
) (
27,777,129
)
Accrued expenses
(
12,658,914
)
9,091,454
Retained money payable on completed projects
-
(
2,635,002
)
Other payables
49,437,564
(
33,479,314
)
Unearned revenue
2,400
67,200
Collections payable
(
639,729
) (
633,969
)
Other current liabilities
(
4,396,433
)
3,971,346
Other liabilities
2,000
(
80,749
)
Net cash provided by (used in) operating activities
121,943,164
(
52,215,697
)
CASH FLOWS FROM INVESTING ACTIVITIES
Increase in long-term lending
(
388,926,789
) (
186,101,333
)
Proceeds from long-term loans receivable
463,621,074
711,420,930
Purchases of available-for-sale financial assets
(
269,418,126
) (
22,557,397
)
Proceeds from disposal of available-for-sale financial assets
-
241,425,010
Purchases of held-to-maturity financial assets
(
758,787,176
) (
650,165,051
)
Proceeds upon maturity of held-to-maturity financial assets
505,769,824
400,000,000
Purchases of financial assets carried at cost
(
1,004,407
) (
181,982,202
)
Withdrawal of financial assets carried at cost
325,000,000
1,527,501
Acquisition of fixed assets
(
10,044,824
) (
8,972,613
)
Proceeds from disposal of fixed assets
66,570
15,775
Decrease in deposits-out
21,112
90,994
Increase in deferred expenses
(
17,755,199
) (
850,968
)
Net cash (used in) provided by investing activities
(
151,457,941
)
303,850,646
CASH FLOWS FROM FINANCING ACTIVITY
(Decrease) increase in deposits-in
(
3,758,000
)
2,605,000
NET (DECREASE) INCREASE IN CASH AND CASH
EQUIVALENTS
(
33,272,777
)
254,239,949
CASH AND CASH EQUIVALENTS AT BEGINNING OF YEAR
7,664,486,792
7,410,246,843
CASH AND CASH EQUIVALENTS AT END OF YEAR
$ 7,631,214,015
$
7,664,486,792
International Cooperation and Development Fund
Statements of Cash Flows
For the Years Ended December 31
(Expressed in NT$)
The accompanying notes are an integral part of these financial statements. See report of independent accountants dated
March 23, 2016.
(versión en inglés)