


 65 / 106

Administration
65
2011
2012
2013
2014
2015
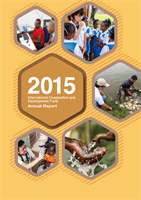
377.85
511.99
Total Revenue
Total Expenditure
408.58
300.32
281.01
382.49
382.16
374.70
375.14
315.38
(NT$ 1 million)
0
200
400
600
Figure 6 Revenue and Expenditure (2011-2015)
* Includes Half Two 1999
12,028
1997 1998 1999* 2000 2001 2002 2003 2004 2005 2006 2007 2008 2009 2010 2011 2012 2013 2014 2015
11,614
11,614
12,219
12,219 12,667
12,667
12,469
12,469
12,469
12,469
12,469
12,469
12,469
12,469
12,469
12,469
12,469
12,469
12,469
12,479
13,430
13,939
14,726 14,885 14,705 14,711 14,882 15,014 15,227 15,354
15,797 15,888 15,826 15,742 15,729 15,783
15,649
Founding and Donated Funds
Fund Balance
(NT$1 million)
(Year)
10,000
15,000
20,000
Figure 7 Fund and Fund Balances (Since 1997)
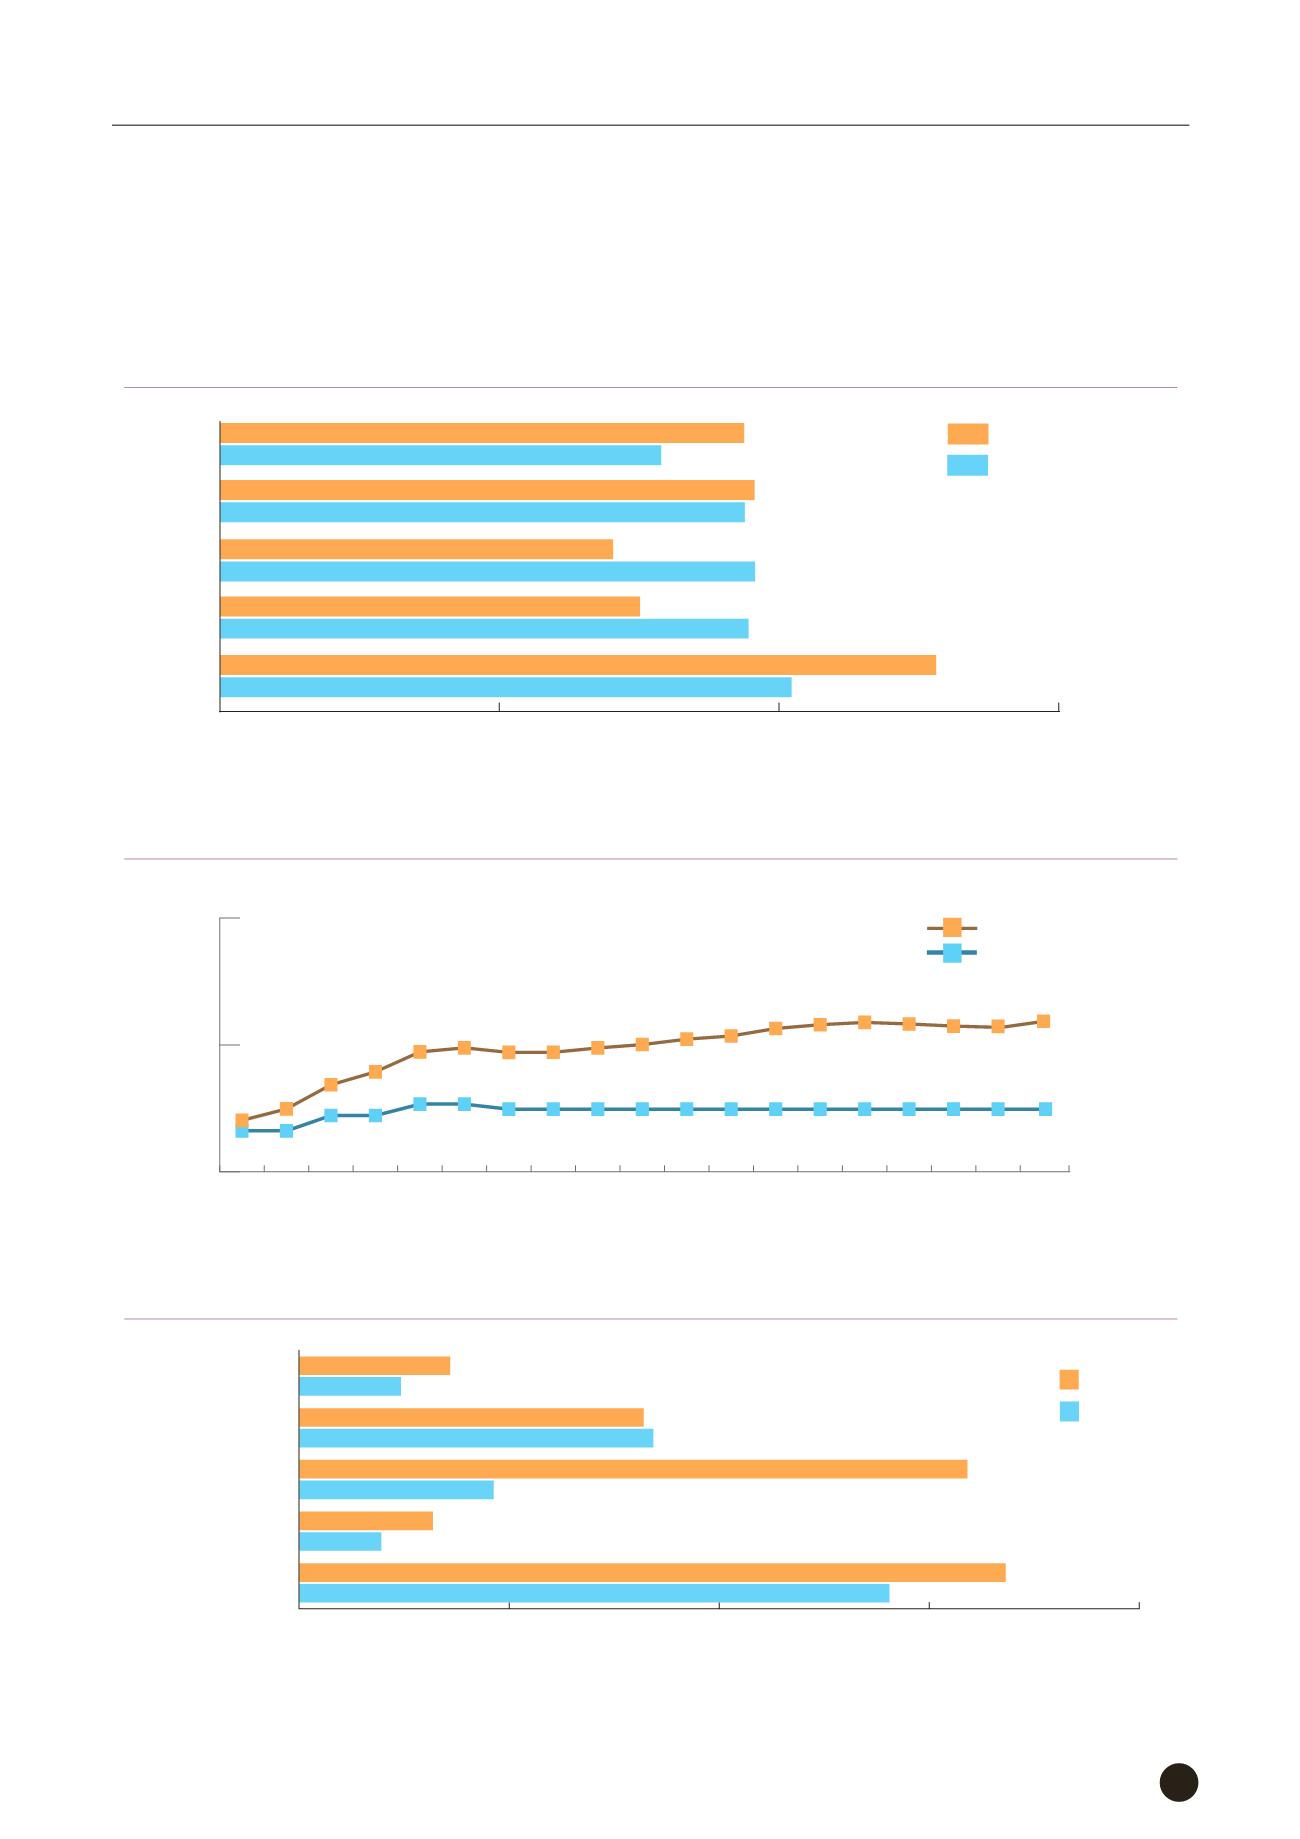
3,595
2,421
8,203
8,432
15,919
4,630
3,183
1,954
16,822
14,052
Lending and Investment
International Education
and Training
Technical Cooperation
Humanitarian Assistance
Budgeted
Actual
(NT$10,000)
0
5,000
10,000
15,000
20,000
Management and
General Affairs
Figure 8 Budgeted and Actual Expenditure (2015)