


 62 / 106

62
earned in 2015 from lending development projects stood
at NT$ 91.9 million, for a rate of return of 2.53 percent
(compared to 2.71 percent in 2014, a fall of 0.18 percent).
In 2015, two investment projects contributed to a profit
of NT$17.36 million for a return rate of 0.99 percent.
Total aggregated return on long-term investment and
lending development projects was NT$192.5 million with
a combined return rate of 2.03 percent. Compared to
a total aggregated income in 2014 of NT$99.64 million,
this represents an increase of around NT$9.61 million
(aggregated return rate in 2014 was 1.73 percent, an
increase of 0.30 percent), while compared to NT$112.35
million in 2013, a reduction of NT$3.1 million. In terms of
asset quality, as of December 31, 2015, there were no bad
debts or delayed payments, and in compliance with the
organization’s provisions on long-term loans, receivables,
and overdue payments, these were recorded as a reserve
for allowances for bad debts to provide a fair and objective
picture of asset quality.
Management of Uncommitted Funds
The financial investment of the uncommitted portion of
the Fund is designed to increase the efficiency with which
funds are used and to increase the TaiwanICDF’s revenues.
Currently these investments focus on fixed-income
financial instruments, supplemented by risk-bearing assets
in the form of exchange-traded funds by way of long-term
holdings of equities.
Fixed-income assets are primarily invested in
bonds, time deposits and short-term commercial paper
denominated in NT dollars and foreign currencies that are
held to maturity. With the delay in raising interest rates by
the U.S. government, the overall performance of interest
rates was sluggish. In 2015, we increased our bond
holding position, and the average rate of return gradually
rose from 2.34 percent in 2013 and 2.45 percent in 2014,
to 2.57 percent in 2015. In addition, the bond position as a
percentage of Fund net worth rose from 14 to 16 percent.
As for risk-bearing assets, with acceptable financial risks
in 2015, the Board of Directors agreed to increase the
upper limit for investment in risk-bearing assets. Thus, risk-
bearing assets rose from 2.55 percent of Fund net worth in
2014 to 6.37 percent, with exchange-traded fund holdings
increasing by 28 percent over the previous year and
dividend income increasing by 65 percent.
With our strategy in 2015 of raising the average return
of bond investments and expanding exchange-traded
fund investment to increase dividend income, financial
investment income, excluding foreign exchange gains
(losses) and other income (expenses), was NT$181.12
million, representing an increase of NT$17.77 million over
the NT$163.35 million (excluding disposed exchange-
traded funds capital gains of NT$44.89 million) of 2014,
registering an increase of 11 percent. Compared to
NT$154.72 million in 2013, this means an increase of
NT$26.4 million or 17 percent. In addition, compared to an
annual budget income target of NT$ 129.67 million, this
means an increase of NT$51.45 million, or 40 percent.
The rate of return for financial investments in 2015 was
1.74 percent whereas the previous year it was 2.11 percent
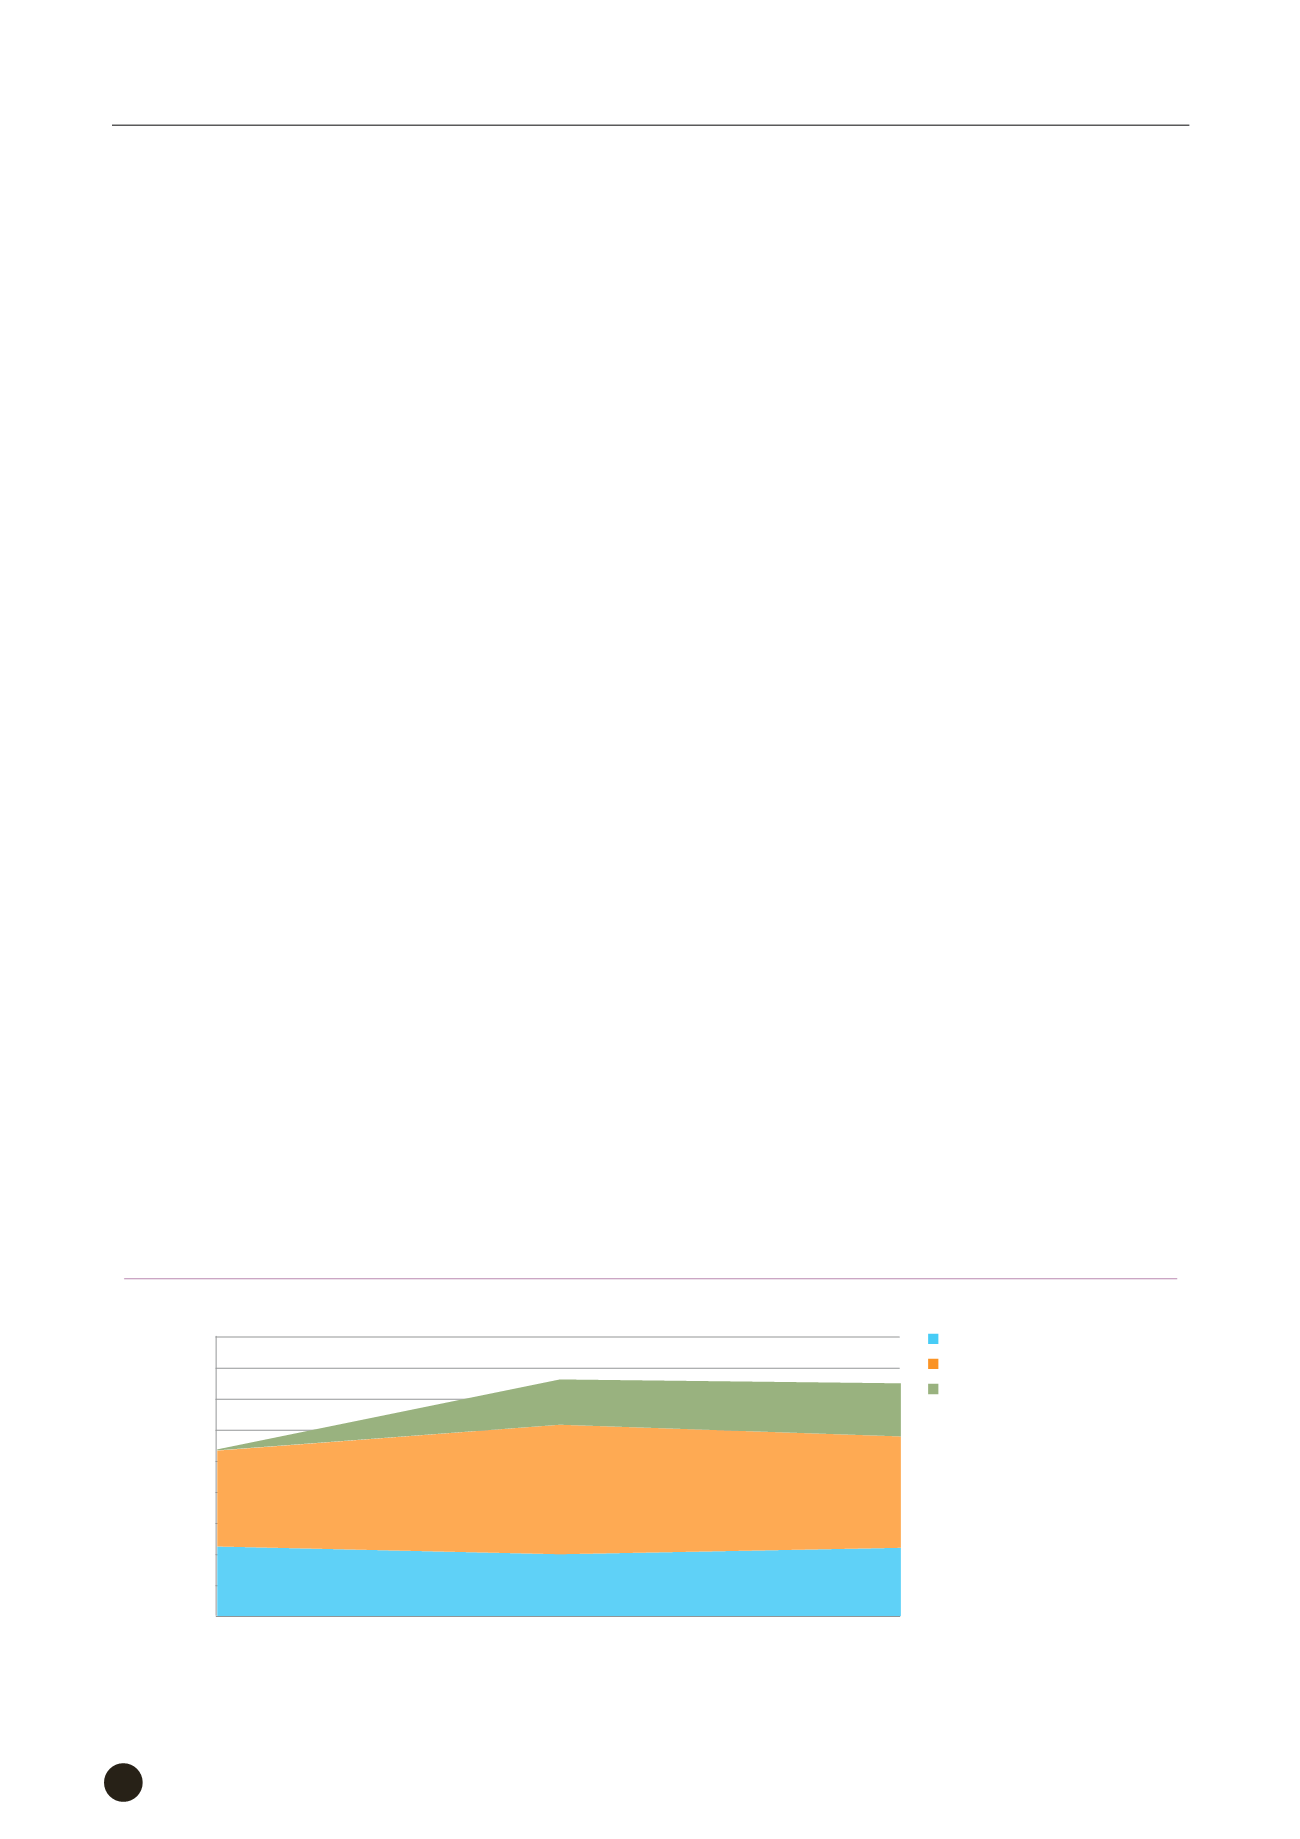
(NT$10,000)
45,000
40,000
35,000
30,000
25,000
20,000
15,000
10,000
5,000
0
2013
2014
2015
20,824
7,311
9,964
10,925
18,112
8,384
74
15,472
11,235
Lending and Investment
Financial Investments
Exchange and Other Gains (Losses)
Figure 2 Fund Revenue (2013-2015)