Page 65 - 國合會2016電子書-英文
P. 65

Administration


               As of December 31, 2016, total assets stood at NT$16   the total budget for MOFA-commissioned projects was
            billion, of which current assets comprised 47.81 percent,   NT$1.16 billion and the implementation rate was 99.59
            long-term investments and loans 51.92 percent, fixed   percent.
            assets 0.15 percent and other assets 0.12 percent.   Operating expenses (excluding expenses for
            The organization’s total liabilities were NT$199.69   contracted projects) amounted to NT$300.73 million.
            million and the total balance of all funds (the Fund   Compared with the budgeted plan of NT$354.22
            plus accumulated earnings) was NT$15.8 billion.   million, the utilization rate came to 84.90 percent.
                                                              Actual budget and expenditures in 2016 are shown in
            Budget Execution                                  Figure 8.
               In 2016, MOFA contracted the TaiwanICDF to carry
            out overseas operations worth NT$1.15 billion. Overall,


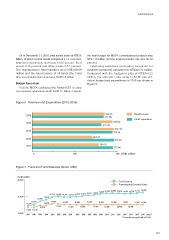
            Figure 6   Revenue and Expenditure (2012-2016)


                                                                           328.95              Total Revenue
                   2016
                                                                           321.88
                                                                                                Total Expenditure
                   2015                                                          374.70
                                                                          315.38
                                                                                  382.16
                   2014
                                                                                 375.14
                                                                   281.01
                   2013                                                           382.49
                                                                       300.32
                   2012
                                                                                 377.85
                        0                            200                           400  (NT$1 million)


            Figure 7   Fund and Fund Balances (Since 1996)


             (NT$10,000)
             20,000
                                                                                     Fund Balance
                                                                                     Founding and Donated Funds


                                                                       15,649  15,797 15,888 15,826 15,742 15,729 15,783  15,796
                                                              15,227 15,354
                                    14,726 14,885 14,705 14,711  14,882 15,014
             15,000             13,939
                           13,430
                       12,479        12,667  12,469   12,469  12,469  12,469   12,469   12,469  12,469 12,469
                   12,028       12,219
                                         12,667          12,469
                             12,219              12,469            12,469  12,469  12,469  12,469
                   11,614  11,614
             10,000
                    1997  1998  1999*  2000  2001  2002  2003  2004  2005  2006  2007  2008  2009  2010  2011  2012  2013  2014  2015  2016 (year)
                                                                                       * Includes second half of 1999


                                                                                                               63
   60   61   62   63   64   65   66   67   68   69   70