
Page 88 - 國合會2016電子書-英文
P. 88
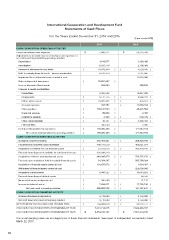
International Cooperation and Development Fund
                                               Statements of Cash Flows

                                    For the Years Ended December 31, 2016 and 2015
                                                                                                (Expressed in NT$)

                                                                     2016                      2015
             CASH FLOWS FROM OPERATING ACTIVITIES
             Excess of revenues over expenses                $         7,069,271        $         59,323,768
             Adjustments to reconcile excess of revenues over expenses to
             net cash (used in) provided by operating activities:
                Depreciation                                           4,545,577                  3,458,495
                Amortization                                           6,323,170                  2,196,408
                Reversal of allowance for bad debts         (         10,078,349  )   (           4,550,445  )
                Held-to-maturity financial assets - interest amortization  6,193,379              7,221,485
                Impairment loss on financial assets carried at cost           -                  12,616,040
                Gain on disposal of investment              (         33,662,687  )                      -
                Loss on disposal of fixed assets                        909,504                    368,528
                Changes in assets and liabilities:
                     Receivables                                       9,425,533                 13,927,209
                     Prepayments                            (          3,112,115  )   (           3,888,241  )
                     Other current assets                   (         19,422,422  )   (            476,971  )
                     Accrued expenses                                   265,752       (          12,658,914  )
                     Other payables                         (        138,142,533  )              49,437,564
                     Unearned revenue                       (            69,600   )                  2,400
                     Collections payable                    (             2,393   )   (            639,729  )
                     Other current liabilities              (            48,147   )   (           4,396,433  )
                     Other liabilities                                  345,580                      2,000
                Cash (used in) provided by operations       (        169,460,480  )             121,943,164
                            Net cash (used in) provided by operating activities  (  169,460,480  )  121,943,164
             CASH FLOWS FROM INVESTING ACTIVITIES
                Increase in long-term lending               (        276,465,851  )   (         388,926,789  )
                Proceeds from long-term loans receivable             409,747,510                463,621,074
                Acquisition of available-for-sale financial assets  (  57,373,616  )  (         269,418,126  )
                Proceeds from disposal of available-for-sale financial assets  325,638,210               -
                Acquisition of held-to-maturity financial assets  (  940,845,878  )   (         758,787,176  )
                Proceeds upon maturity of held-to-maturity financial assets  91,354,387         505,769,824
                Acquisition of financial assets carried at cost  (   134,870,072  )   (           1,004,407  )
                Withdrawal of financial assets carried at cost                -                 325,000,000
                Acquisition of fixed assets                 (          6,006,527  )   (          10,044,824  )
                Proceeds from disposal of fixed assets                        -                     66,570
                (Increase) decrease in deposits-out         (           345,580   )                 21,112
                Increase in deferred assets                 (          7,494,921  )   (          17,755,199  )
                            Net cash used in investing activities  (  596,662,338  )  (         151,457,941  )
             CASH FLOWS FROM FINANCING ACTIVITY
                Increase (decrease) in deposits-in                     9,719,000      (           3,758,000  )
                Net cash flows from (used in) financing activities     9,719,000      (           3,758,000  )
             NET DECREASE IN CASH AND CASH EQUIVALENTS      (        756,403,818  )   (          33,272,777  )
             CASH AND CASH EQUIVALENTS AT BEGINNING OF YEAR         7,631,214,015              7,664,486,792
             CASH AND CASH EQUIVALENTS AT BEGINNING OF YEAR  $      6,874,810,197       $      7,631,214,015

             The accompanying notes are an integral part of these financial statements. See report of independent accountants dated
             March 22, 2017.


       86