
55
4
Administration
Figure 7 Fund Expenditures (2014)
Cash
Dividends 2%
Other 19% ..........................
26% Lending
and Investment
........
Interest on Fund
Investments 41% ............
Gains on Sales of
Investment 12% ............
........
Management
and General
Affairs 40%
Lending and
Investment 14% ............
........
6% Humanitarian
Assistance
19% International
Education and
Training
21% Technical
Cooperation
....................
.........
...........
Figure 8 Revenues and Expenditures (2010-2014)
14,726 14,885 14,705 14,711 14,882 15,014 15,227 15,354
15,797 15,888 15,826 15,742 15,729
15,649
538.45
(NT$1 million)
Fund Balance
(NT$1 million)
Total Expenditures
Budgeted
Total Revenues
390.29
408.58
377.85
382.16
300.32
375.14
511.99
2012
2011
2010
2014
3,945
5,133
7,220
15,951
8,012
2,183
2,065
16,711
14,968
7,774
(NT$10,000)
0
200
400
600
281.01
382.49
2013
0
5,000
10,000
15,000
20,000
15,000
20,000
Founding and Donated Funds
Actual
Management and
General Affairs
Lending and
Investment
Humanitarian
Assistance
International
Education and
Training
Technical
Cooperation
Figure 6 Fund Revenues (2014)
Cash
Dividends 2%
Other 19% ..........................
26% Lending
and Investment
........
Interest on Fund
Investments 41% ............
Gains on Sales of
Investment 12% ............
........
Management
and General
Affairs 40%
Lending and
Investment 14% ............
........
6% Humanitarian
Assistance
19% International
Education and
Traini g
21% Technical
Cooperation
....................
.........
...........
Figure 9 Fund and Fund Balances (Since 1997)
12,028
1997 1998 1999* 2000 2001 2002 2003 2004 2005 2006 2007 2008 2009 2010 2011 2012 2013 2014
11,614
11,614
12,219
12,219 12,667
12,667
12,469
12,469
12,469
12,469
12,469
12,469
12,469
12,469
12,469
12,469
12,469
12,469
12,479
13,430
13,939
14,726 14,885 14,705 14,711 14,882 15,014 15,227 15,354
15,797 15,888 15,826 15,742 15,729
15,649
538.45
(NT$1 million)
Fund Balance
(NT$1 million)
Total Expenditures
Budgeted
Total Revenues
390.29
408.58
377.85
382.16
300.32
375.14
511.99
2012
2011
2010
2014
3,945
5,133
7,220
15,951
8,012
2,183
2,065
16,711
14,968
7,774
(NT$10,000)
(
Year
)
* Jul.-Dec. 1999; 2000
0
200
400
600
281.01
382.49
2013
0
5,000
10,000
15,000
20,000
10,000
15,000
20,000
Founding and Donated Funds
Actual
Management and
General Affairs
Lending and
Investment
Humanitarian
Assistance
International
Education and
Training
Technical
Cooperation
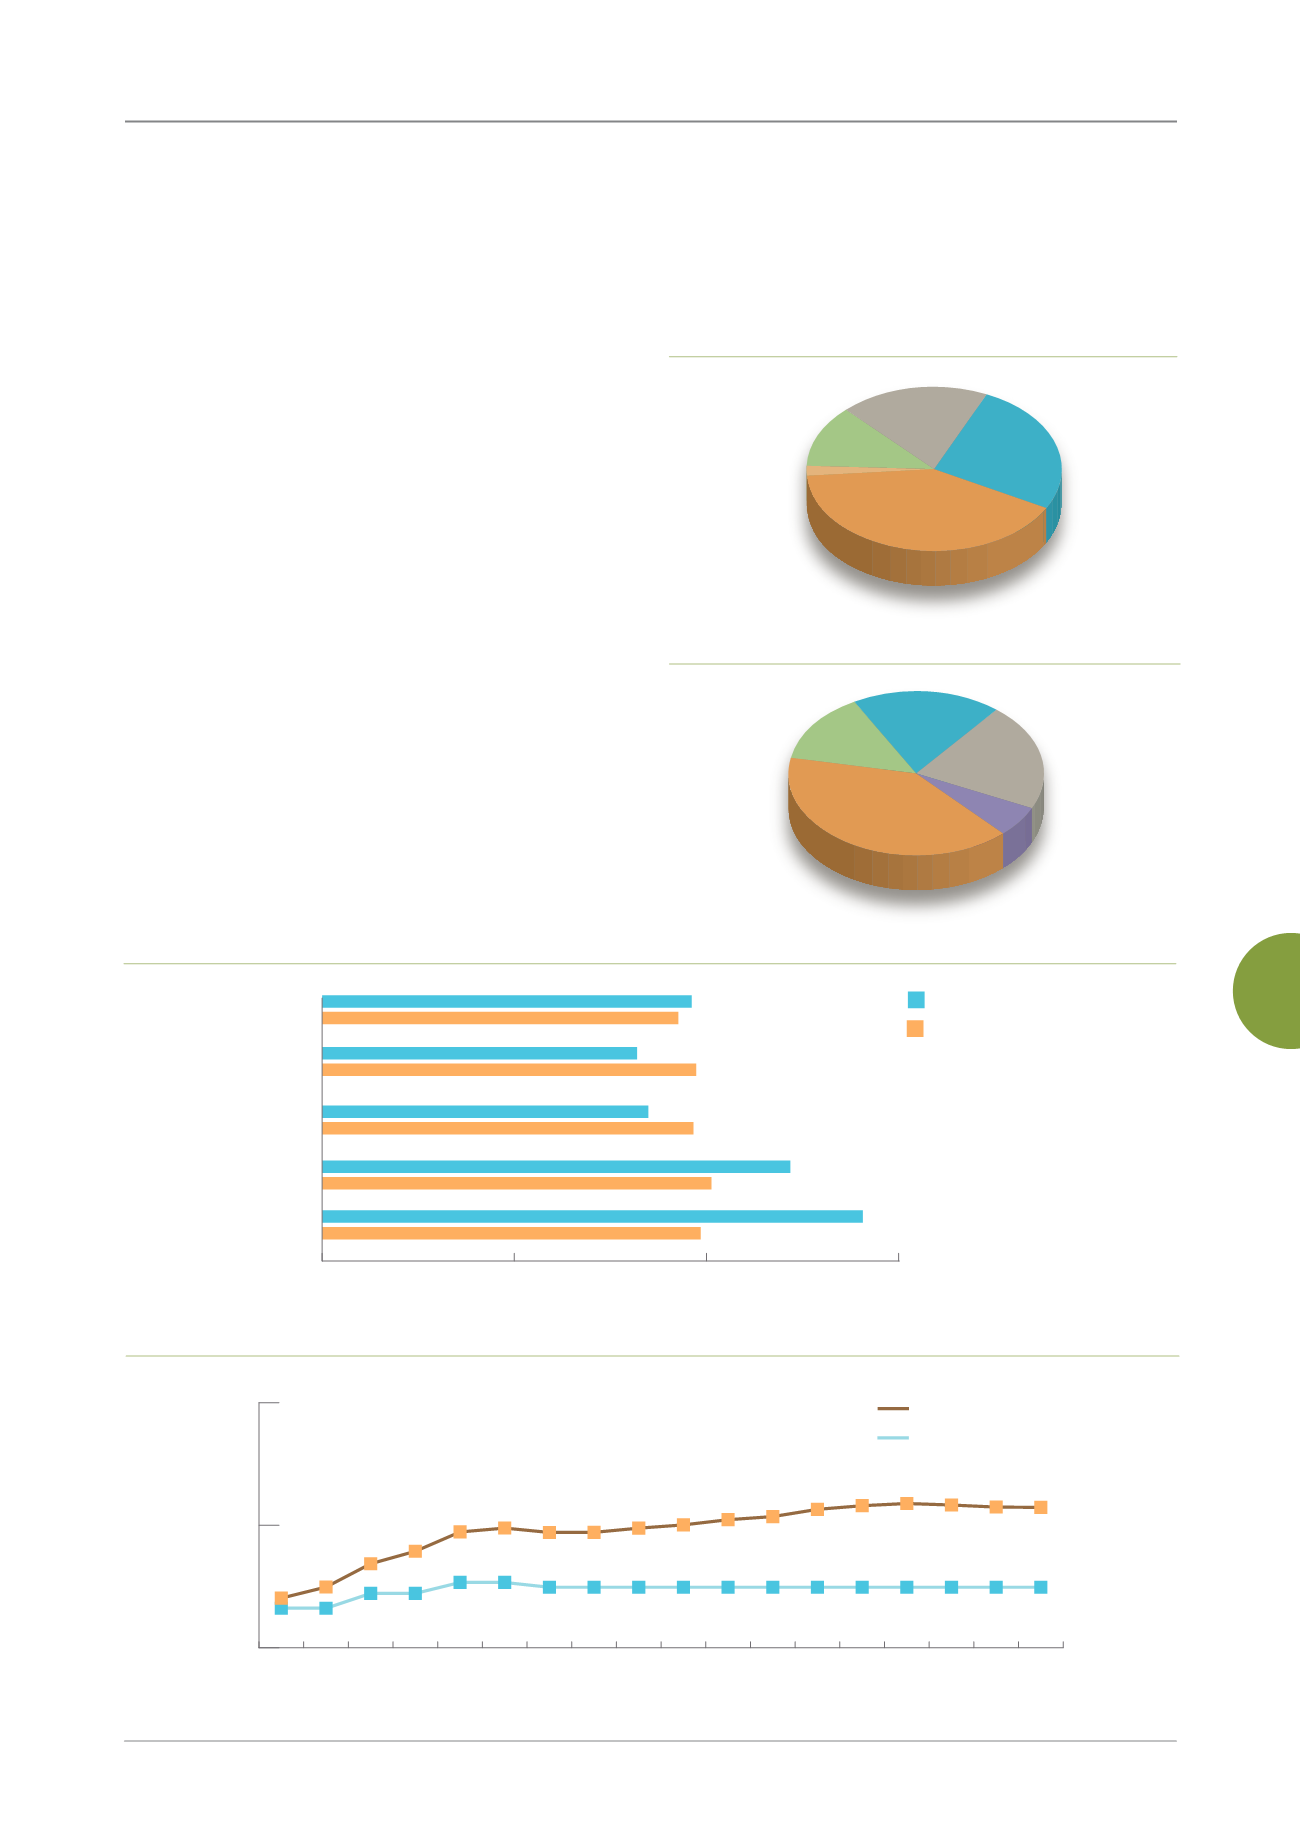
As of December 31, 2014, total assets stood at
NT$16.11 billion, of which current assets comprised the
largest share (55.62%), followed by long-term loans and
investments (44.26%), fixed assets (0.11%) and other
assets (0.01%). The organization’s total liabilities were
NT$381.11 million and the total balance of all funds (the
Fund plus accumulated earnings) was NT$15.73 billion.
Budget Execution
In 2014, MOFA contracted the TaiwanICDF to carry
out overseas operations worth NT$1.13 billion, of which
NT$389.22 million was budgeted for operating expenses
at overseas technical and medical missions, and of which
NT$138.87 million was also allocated to four projects
relating to specific overseas missions. We were also
contracted to implement 48 projects worth NT$560.34
million, including the International Higher Education
Scholarship Program, the Capability Enhancement
in Using Geographic Information Systems in Central
America Project, the Feed Production Project in Paraguay,
and the Vocational Training Technical Assistance Project
in Burkina Faso. NT$41.87 million was also allocated to


