


 82 / 98

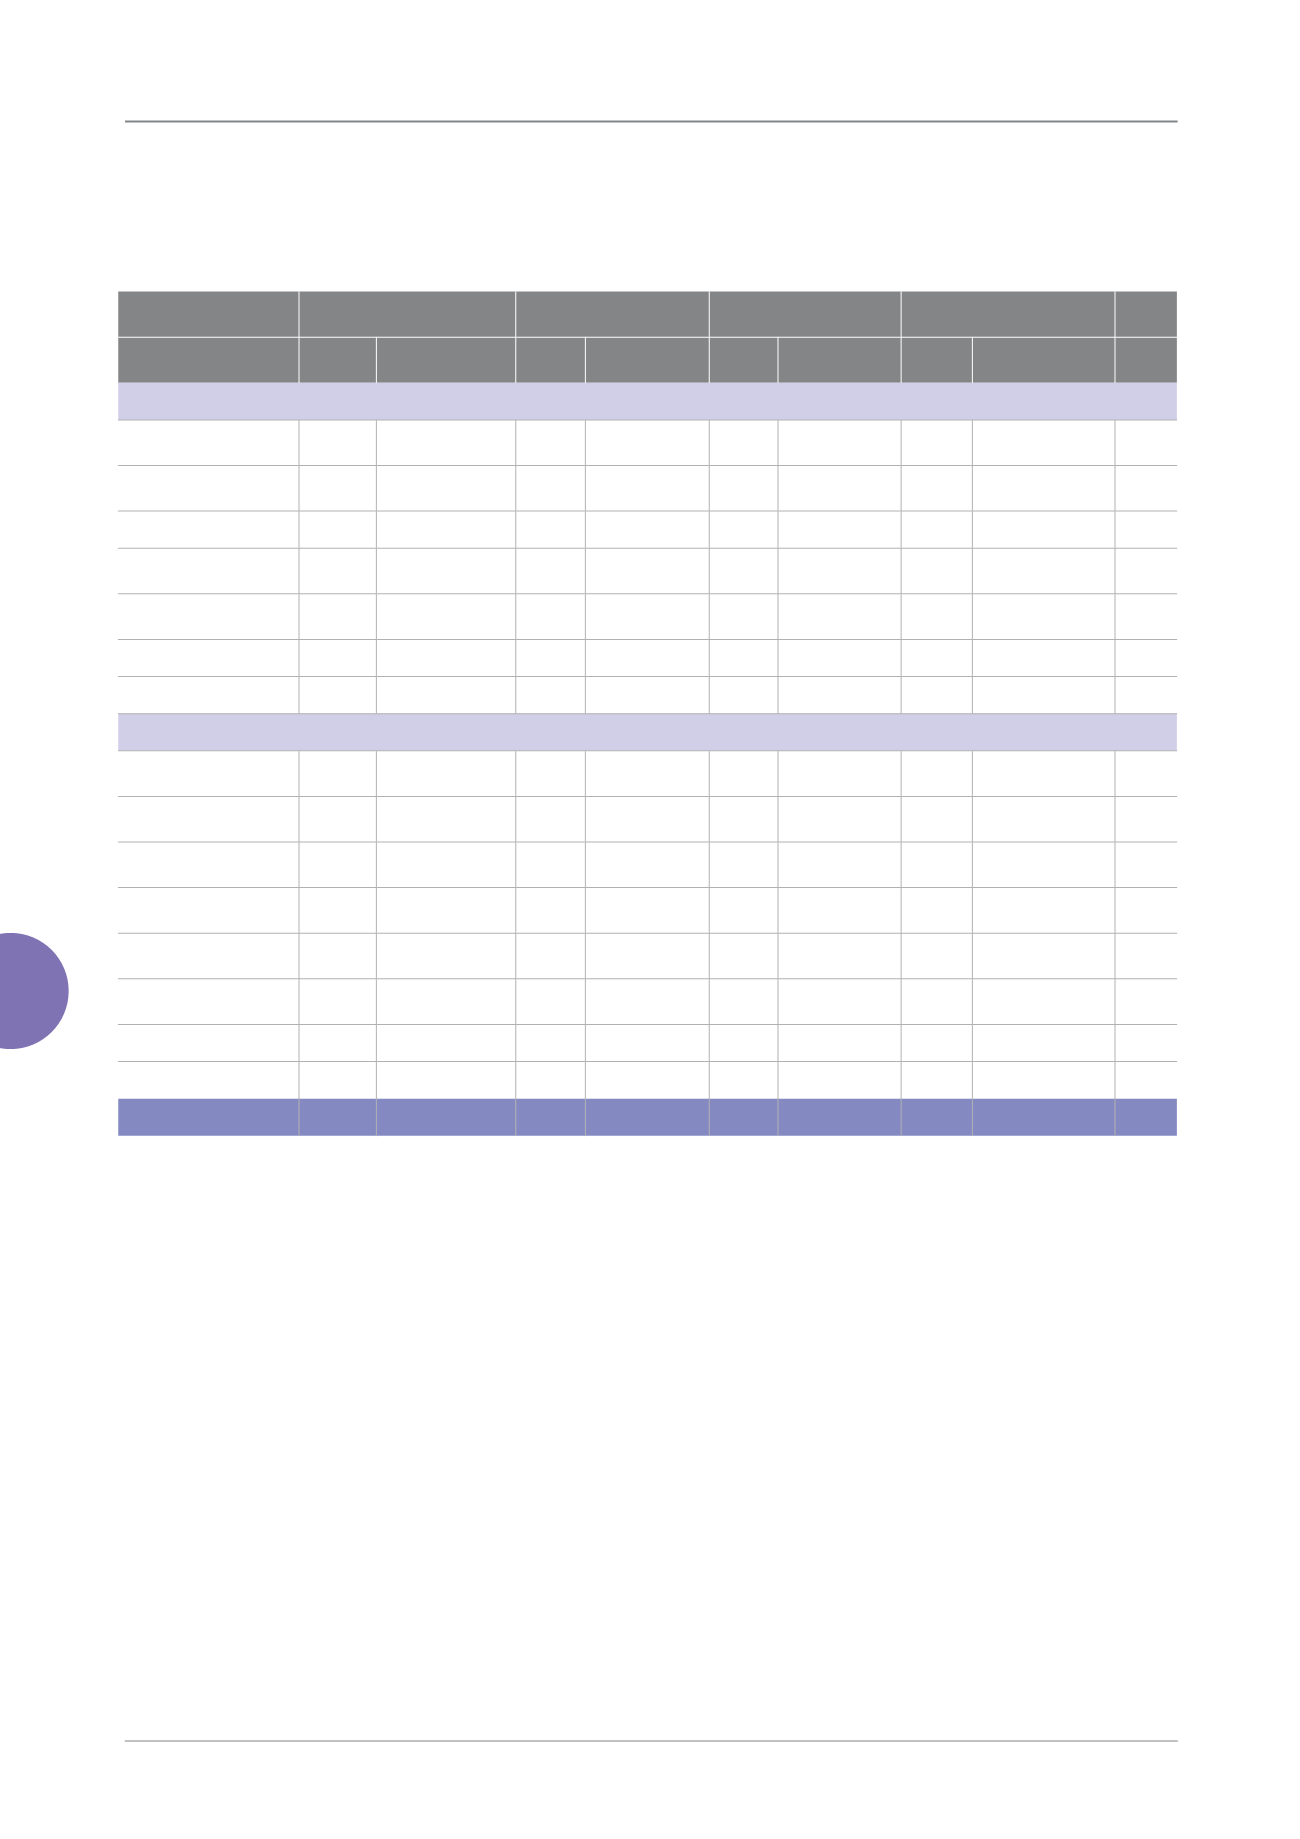
82
Beginning Balance Acquisition of Long-
term Investments
Decrease in Long-
term Investments
Ending Balance
Owner-
ship
Carrying
Amount
Owner-
ship
Carrying
Amount
Owner-
ship
Carrying
Amount
Owner-
ship
Carrying
Amount
Note
Equity investments accounted for using cost method
Overseas Investment &
Development
14.44% $ 130,000,000
-
$ -
-
$ - 14.44% $ 130,000,000 None
Less: Accumulated
impairment
( 6,000,000 )
-
-
( 6,000,000 )
124,000,000
-
-
124,000,000
BTS Private Equity
Fund in India
6.8% 124,024,153
-
1,082,202
-
1,527,501
6.8% 123,578,854 None
Less: Accumulated
impairment
( 53,499,324 )
( 25,743,735 )
-
( 79,243,059 )
70,524,829
( 24,661,533 )
1,527,501
44,335,795
194,524,829
( 24,661,533 )
1,527,501
168,335,795
International Institution Investment Fund
FIISF-Small Business
Account
325,000,000
-
-
325,000,000 None
FIISF-Small Business
Account-Phase
Ⅱ
330,660,000
-
-
330,660,000 None
FIISF-Small Business
Account-Phase
Ⅲ
410,650,000
180,900,000
-
591,550,000 None
MIF-Specialized
Financial Intermediary
476,300,000
-
-
476,300,000 None
FIISF-Trade Facilitation
Program
161,750,000
-
161,750,000
- None
Less: Accumulated
impairment
( 161,750,000 )
-
( 161,750,000 )
-
-
-
-
-
1,542,610,000
180,900,000
-
1,723,510,000
$1,737,134,829
$156,238,467
$ 1,527,501
$1,891,845,795
International Cooperation and Development Fund
Statement of Changes in Financial Assets Carried at Cost
For the Year Ended December 31, 2014
(Expressed in NT$)